Guided tour through Open Budgets
The goal of the City of Madrid’s budget visualization web is to enable any person to find, with just a few clicks, visually, and without having to dig into hundreds of pages full of tables, any figure from the city budgets in the last few years. If this is your first time and don’t where to start from, we’ll guide you through some of the most relevant features.
What information can you find?
This website shows the consolidated budgets of income and expenditure of the Madrid City Council and its Autonomous Bodies from 2011 to the current year. In the section of Global Vision you can also see the main budget indicators: gross and net savings as well as the funding capacity/necessity of the City Council.
From the big figures to the small amounts
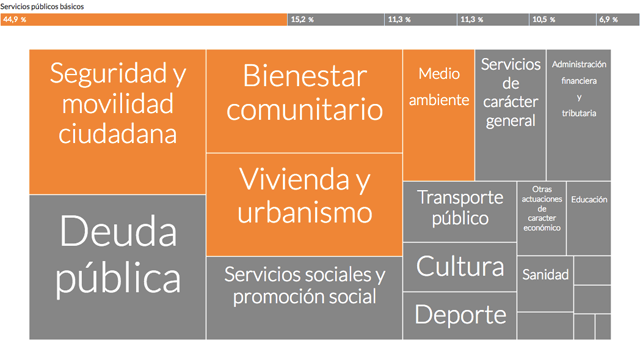
From the homepage you can access the overview page, which shows a quick comparison of the main revenues and expenditures, or access the policy page, where, at a glance, you can see how the budget is broken down into programs and policies. If you take a look at the colors, you’ll notice they’re grouped in some basic areas described in the upper bar and that, for example, 44.9% of the budget is spent on keeping basic public services running.
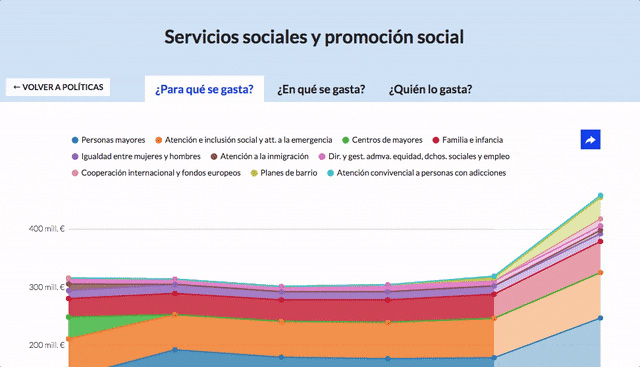
You can start digging into any of the big figures, finding ever-increasing details. For example, from the 'Social services and social promotion' policy you can go into the 'Elderly people' programme.
Not only the budget data, also the actual spending
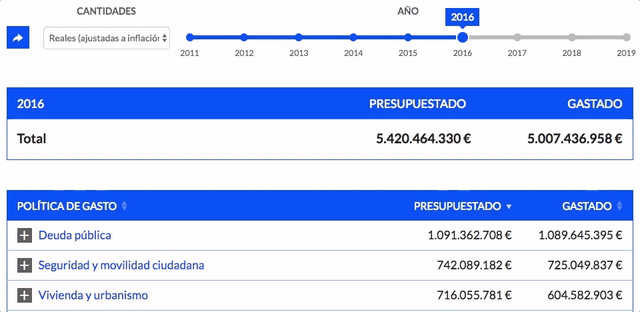
The City of Madrid’s budget site not only tells you about the budget breakdown, but also about the actual execution every month. That is, you can know what the total forecast (initial forecast plus/minus modifications) for the expenditure is and find out how much of a given budget allocation has been spent up until last month. The data for closed years correspond to the settled budgets.
The actual figures are shown next to the budgeted ones in all the tables in the site and, also, graphically, in the data visualizations. The blue bands in the overview chart, for example, show you how much has been collected or spent so far, versus the total expected in the budget (the grey background).
The revenues also
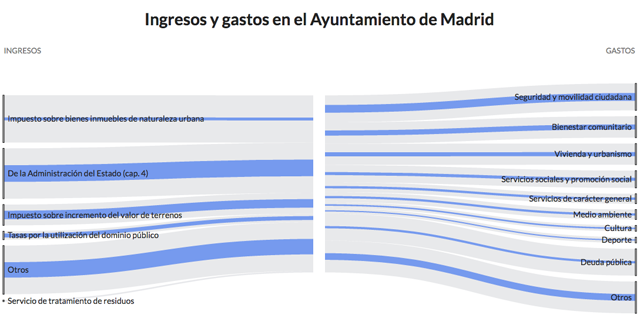
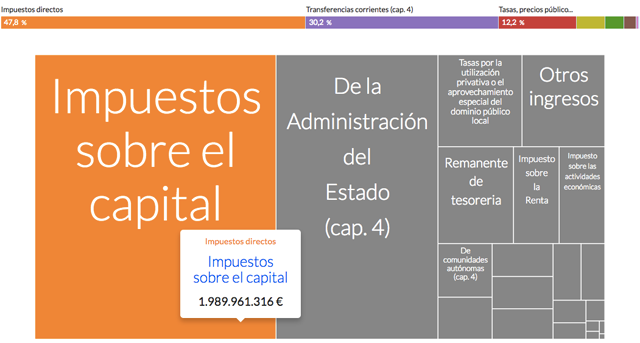
This site also includes information about revenues. The visualization shows the main streams that make up the budget and how, for example, capital taxes are the biggest source of income for the city, followed by transfers from the central government.
Quicker: use the search box
So far we’ve been browsing, up and down, in order to reach detailed figures from the overview and back. But if you’re interested in a particular topic there’s a much quicker way: use the search box, which looks into the budget data and help pages like this.
Type, for example, the word "school". The search results page will show two items, two programmes which are part of the Education policy. If you select the first result you’ll see the spending budget for primary schools.
The evolution from 2011
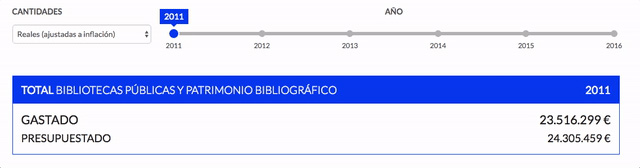
Sometimes your curiosity will go further and you’ll wonder how a certain revenue or expenditure has evolved over the last years. ¿Is more money being allocated for a particular item? ¿Is a given tax collecting more revenue than a few years ago? The City of Madrid’s budget site contains data from 2011. So, for example, you can see how much was allocated, and spent, for public libraries since that year.
Which kind of figures can you see?
You can see the City Council revenue, expenditure and investment amounts in different ways: nominal, real (inflation adjusted), as percentage of total and per capita (real).
Who spent it?
So far we’ve been focusing in the functional classification, which breaks down the budget in a set of policies and programmes which tell us what the money is being spent for. But, in some cases, it’s interesting to know which department or public body is managing the spending. For example, in the Housing and urban planning policy you can see, broken down after you expand the City of Madrid item, which parts are being handled by the districts.
How is it spent?
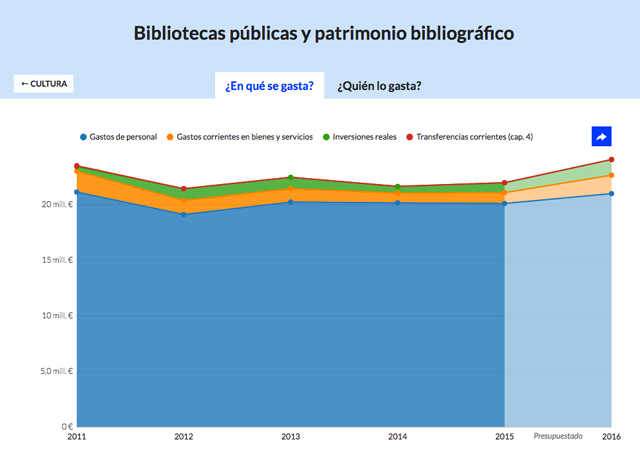
The third leg of the spending budget is the economic classification, that is, how is the money spent? Is it paying personnel salaries, supplies, investments? Is it being transferred to third parties?
For example, if we look at the public libraries policy, we’ll see that the biggest area, in blue, is allocated to pay the salaries of the staff. The table below confirms it: out of the 24 million euros budgeted for 2016, 21 are dedicated to personnel.
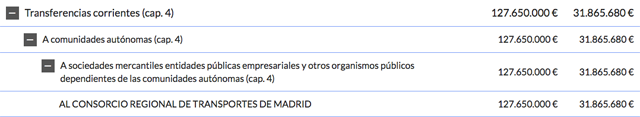
Another example: in the budget for Transportation promotion, control and development the biggest area, again in blue, is allocated to external transfers. In this case, the money the City of Madrid transfers to the Regional Transport Consortium of Madrid.
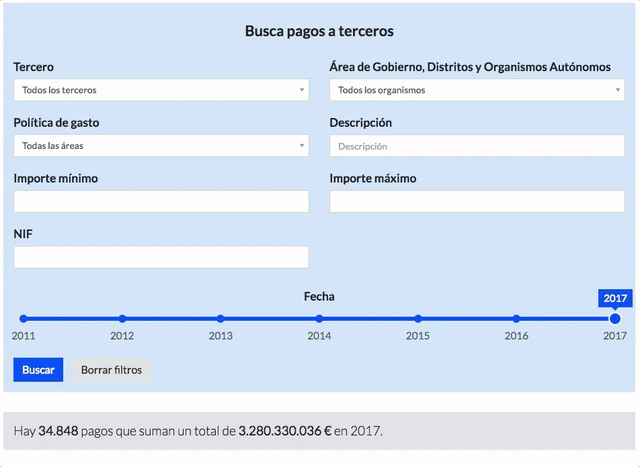
Third-party payments
You can also explore, in detail, payments to third parties: legal or physical persons with whom the City Council has a contractual relationship or agreements, which in 2017 totaled more than 3,280 million and 34,848 transactions. Thus, you can see, for example, the more than 173 million that the City Council contributed to the Regional Transport Consortium of Madrid, which is responsible for the management of the Metro.
In addition to the general figures, you can search by spending policy (culture, sports, education ...), by amount or by the department or public body in the City Council making the payment and the companies or entities receiving it.
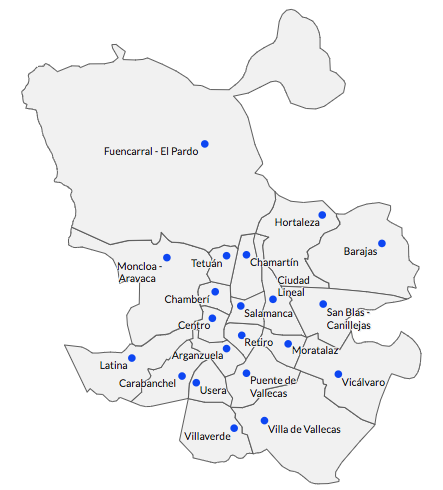
Investment by district
Not only can you know what the City Council is investing in, but also where. In the Investments by district section you have information on the investments distributed over the 21 districts of the city from 2011 to the current date. Thus, in each district you can seek the investments made and being executed, such as: construction or reform of nursery schools, sports centers, cultural centers, equipment for municipal buildings, urban actions and public roads, green areas, etc., to put some examples.
Main investments
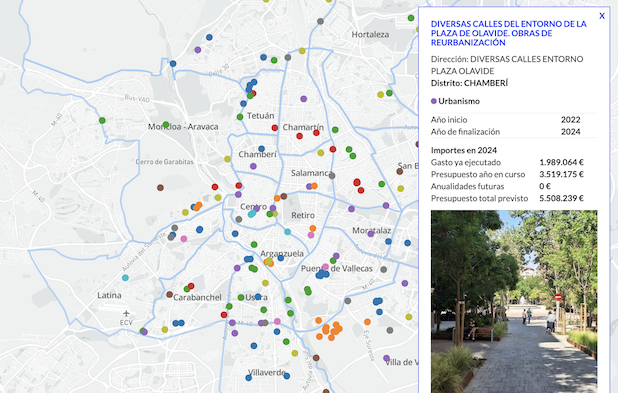
The Main Investments section shows you, in a geolocated format, the most significant projects being carried out by the Madrid City Council, its Autonomous Bodies, and Municipal Companies. The interactive map gives you, at a glance, where the main investments in the city are being implemented. Use the available filters to locate projects in your neighborhood or cultural projects, for example, and discover all the details of each initiative.
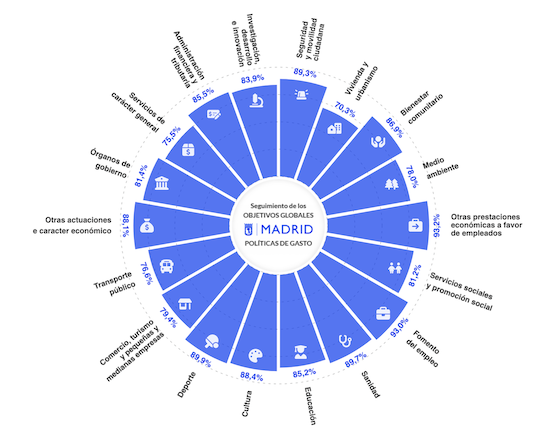
Objetivos e indicadores
Have you wondered if the City Council meets the objectives set in its budgets? In the Objectives section, you can transparently check the degree of fulfillment of the Madrid City Council's budgetary programs through hundreds of specific indicators. You can see not only the initial objectives but also the detailed breakdown of the activities carried out and the indicators used to measure their level of achievement. This way, you can evaluate if the money invested is meeting the established goals.
Any doubt, check the glossary
Concepts like savings, budget classifications (focusing on who spends the budget, how it does it, and what for) and definitions for the main taxes are available in the glossary. So you can answer all your questions.
Vídeo de presentación
Tienes también a tu disposición un video con la presentación general de Presupuestos Abiertos en Vídeo demostrativo de la aplicación de Presupuestos Abiertos.